FunctionsAbsolute Value Functions
Atari's Pong, released in 1972, launched the video gaming industry as we know it. The game is effectively a digital table tennis game. Pong is so popular that pop culture still references it today.
These days gamers can play internet-based variations of pong or visit an arcade with an original Atari Ping console.
MathiPong pays homage to this titan in gaming history. The objective is to direct the ball to the target. Choose regular or challenge mode to get started.

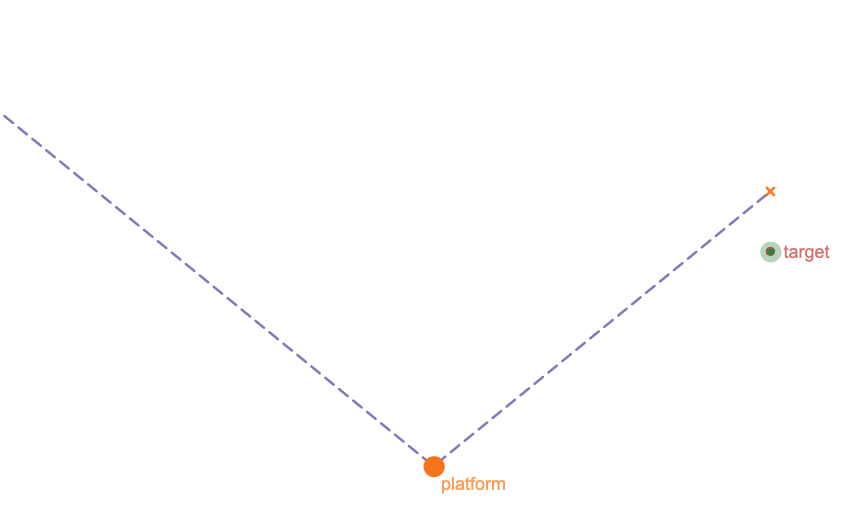
Now that you've played a few rounds and have the idea of how the game works, let's think about a strategy for hitting the target. Let's take a look at the game on a coordinate plane.
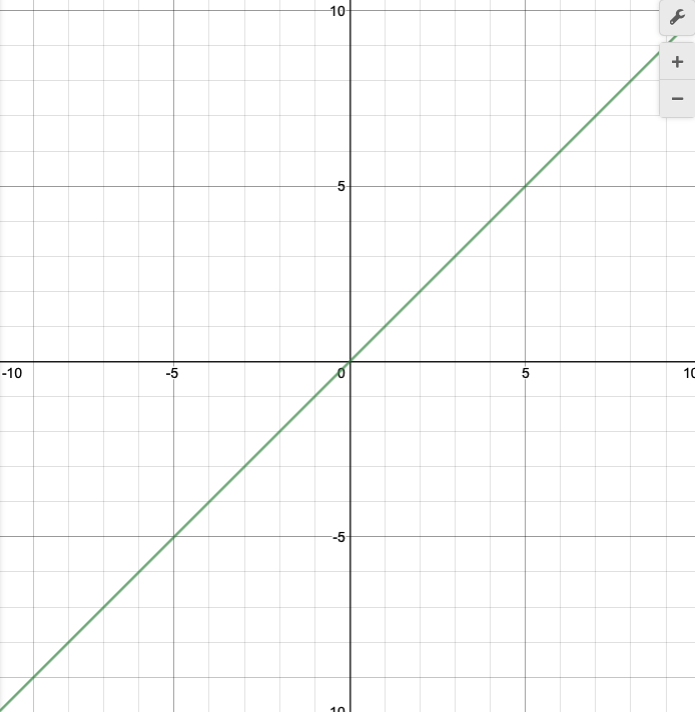
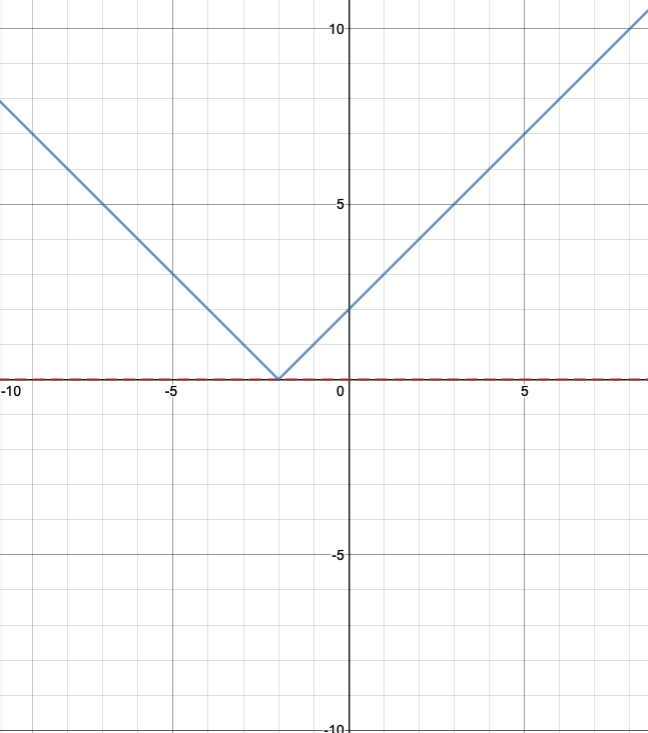
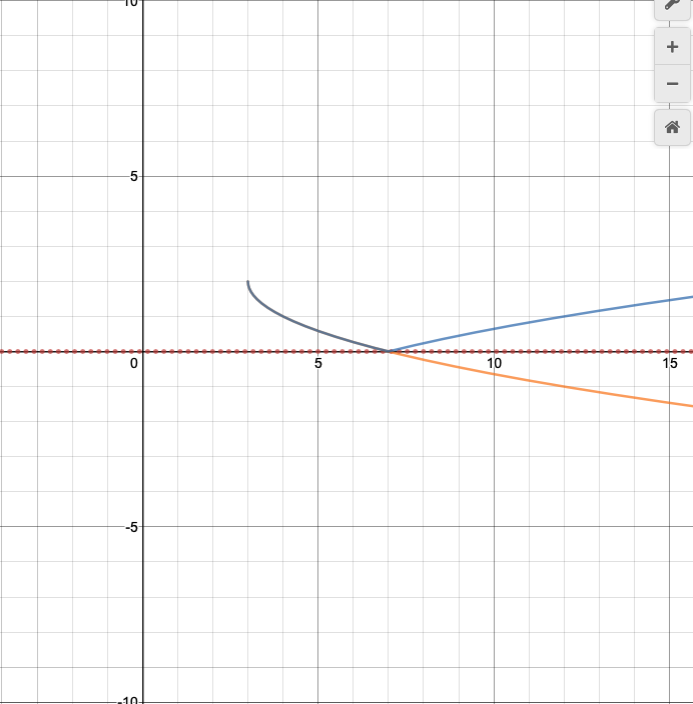
If we just let the ball fall from the upper left part of the screen. It's path will look like this. Here we recognise the slope of the line describing the path of the ball is
We know we want the path of the ball to look like this in order to hit the target. This new line describing the intended path of the ball is
If we move the platform to the intersection of these two lines, the path of the ball will move from its original path to our desired path. The intersection is at (
In the chapter on piecewise functions, we practised writing functions to describe situations like this. That is, we want to use a specific section of one function and a specific section of another. The domain values for the piecewise function describing this path are:
h(x)= \begin{matrix}-x & x
There is actually another way to express the same shape using a different function.
https://www.desmos.com/calculator/vyl1ggpfxc
https://www.desmos.com/calculator/ihajfmgvkl
This v-shaped graph is called an absolute value function. As you can see, the shape is the same as the one described by the piecewise function. In addition to function notation, it uses bars to mean absolute value. Recall that
f(x)=|x|
Absolute value functions have many of the same key features we have been looking at through the functions course. The platform is at a key point called the
Now Mathipong wouldn't be much of a game if the ball always fell from the same spot and the target never moved. Likewise, absolute vallue functions wouldn't be very useful if they only ever occured with the rule f(x)=|x|. Let's have a look at how they move around the coordinate plane.
So far, when we have been graphing functions, we have been either plotting points on the line and connecting them with a line, or we have been finding a significant point, like the y-intercept or x-intercept and counting the slope to construct the line. The graphs and their respective equations actually leads us to a new way of understanding graphs on the coordinate plane. We can think of graphing in terms of
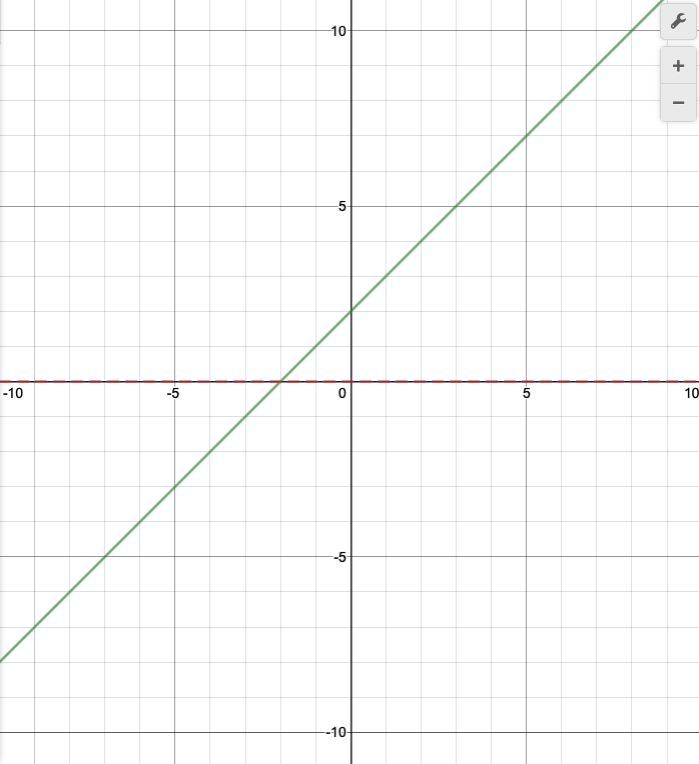
Now graph the line y=x+2.
https://www.desmos.com/calculator/mcwyh3toux
Notice that this line is y=x shift up 2. Or, we could see if as y=x shifted left 2.
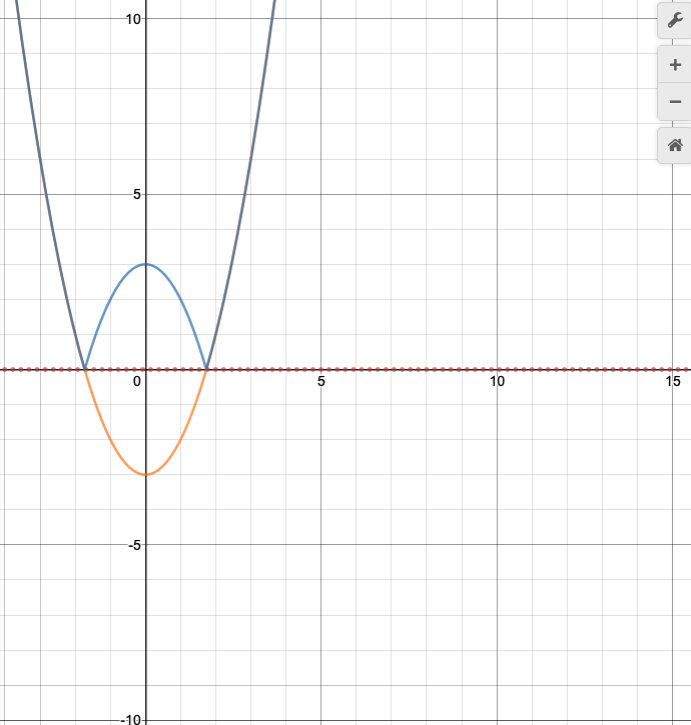
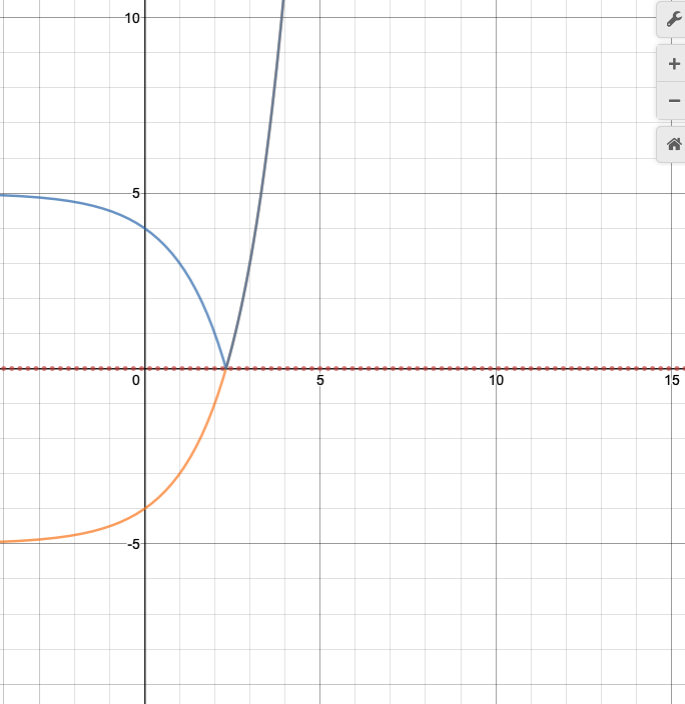
Then let's reflect it over the x-axis.
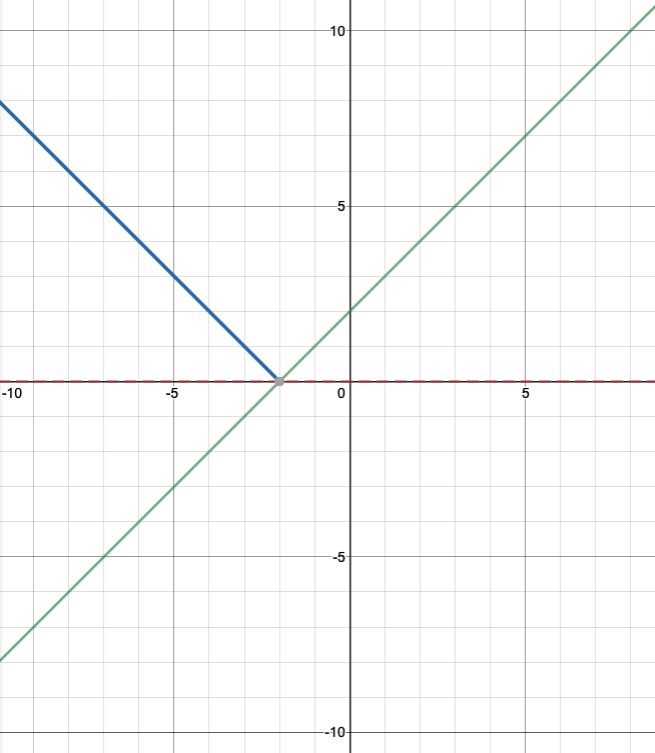
The right side of the original like, the portion above the x-axis, remained unmoved. The left side, everything below the x-axis, reflected up above the x-axis. The position above the x-axis is the same as the graph of f(x)=|x+2|.
Notice y=|x+2| is y=|x| shift to the left 2.
Now suppose we add a number to y=|x| similar to y=x+2. What do you think will happen to the graph?
The graph of y=|x| shift up.
Notice that moving the graph left and right changes values
These two transformations, which we call shifts, clearly result in different graphs. The left graph shows a
Match the function with its graph. Keep in mind the shifts f(x)=|x-h|+k where h is the horizontal shift and k is the vertical shift.
Let's return to this idea of reflecting a graph over the x-axis. This is actually not a coincidence that this action give the absolute value function of the original linear function. The same property holds for the absolute value of other kinds of function.
We explore reflections more in Reflecting Functions.
Absolute Error
Let's take a look at how the idea of absolute value can relate to data analysis. There is an kind of measurement called absolute error that quantifies the difference between an expected value and a measured value. For example, we know our thermometer has an error of 2 degrees. The thermometer says it is 25 C right now. We can use absolute values to determine what the lowest and highest possible temperatures the air could be given the error on the theromometer.
Let x represent the actual temperature while 25 is the measured temperature. Their difference gives us the error, which we know is 2. Therefore, we can use the equation |x-25|=2 to determine the possible actual temperatures.
Recall that absolute value measures the distance from zero. This means that that measurement can go in the positive direction or in the negative direction. We don't actually know the intended direction when we are given a value like absolute error is 5. To account for this, we need to look at both options.
Given
Account for the value in the positive direction and the value in the negative direction.
Solve each equation normally.
The solutions give the lowest and highest possible temperatures.
In order to know whether the temperature is higher or lower than our measured value, we would need additional information like a measurement from another thermometer.
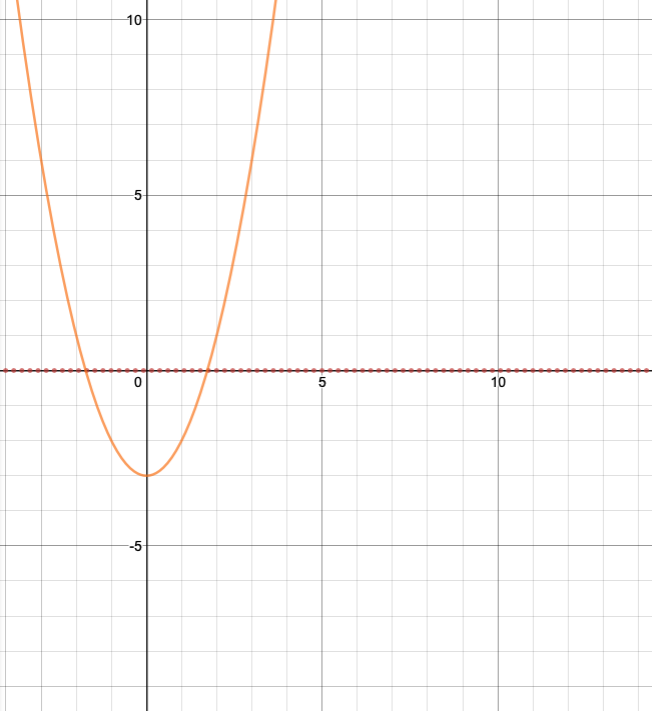
Many different kinds of function have situations like this where they can actually have more than one solution to a problem. We will explore this idea in more depth in quadratic functions.
Now that we know more about absolute value functions and how they work, take a swing at the next level of Mathipong.